KMeans Data Analysis in C
What interests me nowadays was greatly influenced by the many interesting projects I developed during my licentiate degree. One of those projects was to Analyse and Segment Data using KMeans in C.
This project was started with Daniel Alves and later on completed with the help of my colleague and friend Daniel Afonso.
Context
The Portuguese Basketball Federation keeps a record of all the detailed information about every game (points, fouls, assists, blocks, etc). This information can be consulted here.
The data is collected in every game and afterwards processed statistically, allowing us to obtain performance indicators of each game and player.
The Program
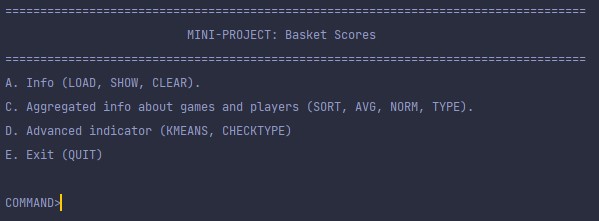
The program has a menu to show the possible commands that allows us to insert and visualize data (e.g. csv file) as well as aggregate operations that further deepen the understanding of the data.
As for the advanced indicators, KMEANS allows us to group types of players based on their performance during the games. And CHECKTYPE segments a selected player based on previous knowledge (for example, we know that a shooting-guard is more prone to have more average Three Pointers than a point-guard)
Example of an aggregate command
In this example we used the SORT command to order the players based on their Birth dates.
1
2
3
4
5
6
7
8
Player   ID :              NAME              | TEAM            | BIRTHDATE  |GENDER| 2POINTS |  3POINTS |  FOULS   | ASSISTS  | BLOCKS   | GAMES  |
At rank 0: Player  45 : Clayton Talley       | Scalipus        | 04/01/1995 | M    |  0.00   |   1.00   |   7.00   |  10.00   |   9.00   |     1  |
At rank 1: Player 177 : Beckham Stuart       | Barreirense     | 08/01/1995 | M    |  0.00   |   0.00   |   0.00   |   0.00   |   0.00   |     0  |
At rank 2: Player  75 : Dorian Kemp          | Galitos         | 21/01/1995 | M    |  0.00   |   0.00   |   0.00   |   0.00   |   0.00   |     0  |
At rank 3: Player  60 : Dillon Valenzuela    | Scalipus        | 12/02/1995 | M    |  0.00   |   1.00   |  10.00   |   8.00   |   9.00   |     1  |
At rank 4: Player 198 : Leon Weiss           | Barreirense     | 05/03/1995 | M    |  0.00   |   0.00   |   0.00   |   0.00   |   0.00   |     0  |
At rank 5: Player 282 : Leila Mclean         | Sampaio         | 08/03/1995 | F    |  1.00   |   2.00   |   4.00   |  16.00   |  18.00   |     2  |
[many more]...
KMeans

KMeans allows us to segment the players based on a predetermined algorithm. This algorithm requires these three inputs:
- number of clusters
- maximum number of iterations
- minimum error variance between iterations
We have two stop criteria:
- number of iterations
- The max number of iterations in a “fitting” run of the algorithm.
- error variance between iterations
- The squared distance of each observation relative to the cluster’s centroid.
Each cluster is represented as follows
1
2
3
4
5
6
7
8
typedef struct cluster {
  float meanTwoPoints;
  float meanThreePoints;
  float meanAssists;
  float meanFouls;
  float meanBlocks;
  PtList members;
} Cluster;
In order for the algorithm to work properly, we must first normalise the data
1
2
3
4
5
6
7
8
9
10
11
12
13
14
15
16
17
18
19
20
21
22
23
24
25
26
27
28
29
30
31
32
33
34
35
PtList normalizeStatistics(PtList players) {
  //max min of all fields
  float twoMax, twoMin;
  float threeMax, threeMin;
  float assistsMax, assistsMin;
  float foulsMax, foulsMin;
  float blocksMax, blocksMin;

  int size;
  listSize(players, &size);

  //max min calculation
  calculateMax(players, &twoMax, &threeMax, &assistsMax, &foulsMax, &blocksMax);
  calculateMin(players, &twoMin, &threeMin, &assistsMin, &foulsMin, &blocksMin);

  Player player;
  Player avgPlayer;
  PtList normList = listCreate(size); //new list to save computed values
  Statistics normStats;
  Statistics stats;
  int index = 0;
  if (players != NULL) {
    for (int i = 0; i < size; i++) {
      listGet(players, i, &player);
      if (player.statistics.gamesPlayed > 0) {
        stats = statNormalizationCalculation(player.statistics, &twoMax, &threeMax, &assistsMax, &foulsMax, &blocksMax,
          &twoMin, &threeMin, &assistsMin, &foulsMin, &blocksMin); //stats norms
        normStats = statisticsAdd(statisticsCreateZeros(), stats, player.statistics.gamesPlayed);
        avgPlayer = playerCreate(player.id, player.name, player.team, player.birthDate, player.gender, normStats);
        listAdd(normList, index++, avgPlayer); //add player to list
      }
    }
  }
  return normList;
}
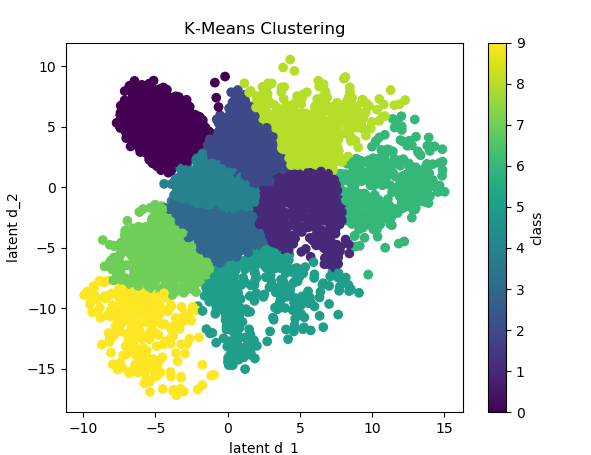
KMeans is a method of analysis used in data mining. Its objective is to partition N observations in K sets (clusters) so that each observation belongs in the nearest mean observation (a cluster). Each observation contains p characteristics.
In each iteration of the algorithm, K centroids are recalculated. Each centroid corresponds to a mean of the observations existent in a cluster. Somewhat similar to a “center of mass”.
In this project, each observation corresponds to a player with normalized data, and each characteristic is one of his statistics. The purpose of this algorithm is to segment the players in existing groups with similar characteristics.
Implementation
To implement the KMeans cluster algorithm first we must understand how to calculate the Euclidean distance and error.
Euclidean Distance
\[d\left( p,q\right) = \sqrt {\sum _{i=1}^{n} \left( q_{i}-p_{i}\right)^2 }\]Error
\[E = \sum_{j=1}^{c}\sum_{x_{i}\epsilon w_{j}}d(x_{i},m_{j})^2\]𝒙𝒊 is the observation in position 𝒊
𝒘𝒋 is cluster 𝒋
𝒎𝒋 centroid of cluster 𝒋
𝒅(𝒙𝒊, 𝒎𝒋) euclidean distance between observation 𝒙𝒊 and centroid 𝒎𝒋
Algorithm Explanation
The Algorithm has as input:
list: list with the normalised observationsk: number of wanted clustersmaxIterations: max number of iterations to performdeltaError: minimum variance of the error between iterations
It outputs the array of computed clusters.
Steps of the Algorithm
- Initialize the k clusters with a random chosen centroid picked from the normalised values.
- Loops these steps until we reach a stopping criteria:
- Assign each observation to the nearest cluster (euclidean)
- Recalculates each of the k centroids based on the cluster’s mean.
- Calculates the Error for the current iteration.
This implementation of the KMeans algorithm has time complexity of O(n^3).
1
2
3
4
5
6
7
8
9
10
11
12
13
14
15
16
17
18
19
20
21
22
23
24
25
26
27
28
29
30
31
32
33
34
35
36
37
38
39
PtClusterList kmeans(PtList list, int k, int maxIteration, float deltaError, float *iterationError) {
  //kmeans
  PtClusterList clusters = clusterListCreate(600); //creating the initial clusters
  Player p;
  Statistics stat;
  int size;
  listSize(list, &size);
  int random;
  Cluster toAdd;

  for (int i = 0; i < k; i++) {
    //get random player stats
    random = (rand() % size);
    listGet(list, random, &p);
    stat = p.statistics;
    toAdd = clusterCreate(stat);
    clusterListAdd(clusters, toAdd);
  }

  int iterationNumber = 1;
  float prevError = FLT_MAX;
  *iterationError = FLT_MAX;

  do {
    if (iterationNumber > 1)
      prevError = *iterationError;

    //Assign
    calculateClosestsClusters(list, clusters, k);
    //Recalculate centroids
    calculateCentroids(clusters, k, &stat);
    //Calculate Error
    *iterationError = calculateError(clusters, k);

    iterationNumber++;
  } while ((iterationNumber < maxIteration) && (fabs(prevError - *iterationError) > deltaError));

  return clusters;
}
Results
For:
K = 5; maxIterations = 20; deltaError = 0.001;
We obtain the following results for each of the clusters: (REDUCED FOR PRESENTATION)
1
2
3
4
5
6
7
8
9
10
11
12
13
14
15
16
17
18
19
20
21
22
23
24
25
26
27
28
29
30
31
Player   ID :              NAME               | TEAM            | BIRTHDATE  |GENDER| 2POINTS |  3POINTS |  FOULS   | ASSISTS  | BLOCKS   | GAMES  |

Cluster 1 ----LIST elements:
At rank 0: Jogador   8 : Lee Woodard          | Scalipus        | 13/09/2004 | M    |  0.08   |   0.08   |   0.75   |   0.85   |   0.75   |     2  |
At rank 1: Jogador  12 : Lee Briggs           | Scalipus        | 12/11/2004 | M    |  0.00   |   0.08   |   0.90   |   0.70   |   0.90   |     2  |
At rank 2: Jogador  25 : Brody Serrano        | Scalipus        | 08/01/2002 | M    |  0.33   |   0.00   |   0.70   |   0.80   |   0.70   |     1  |
...

Cluster 2 ----LIST elements:
At rank 0: Jogador   3 : Halee Singleton      | Scalipus        | 12/10/2001 | F    |  0.72   |   0.78   |   0.37   |   0.60   |   0.87   |     3  |
At rank 1: Jogador  23 : Dahlia Williams      | Scalipus        | 30/12/2005 | F    |  0.88   |   0.79   |   0.62   |   0.90   |   0.95   |     4  |
At rank 2: Jogador  39 : Ivor Ruiz            | Scalipus        | 16/11/2003 | M    |  0.94   |   0.78   |   0.50   |   0.87   |   0.87   |     3  |
...

Cluster 3 ----LIST elements:
At rank 0: Jogador   6 : Gabriel Sargent      | Scalipus        | 04/01/2000 | M    |  0.94   |   0.94   |   0.80   |   0.13   |   0.20   |     3  |
At rank 1: Jogador  13 : Lacota Hyde          | Scalipus        | 22/05/2003 | F    |  0.83   |   1.00   |   0.90   |   0.10   |   0.10   |     2  |
At rank 2: Jogador  20 : Gil Solis            | Scalipus        | 14/02/2005 | M    |  0.83   |   1.00   |   0.60   |   0.10   |   0.20   |     1  |
...

Cluster 4 ----LIST elements:
At rank 0: Jogador   1 : Maile Irwin          | Scalipus        | 28/02/2002 | F    |  0.08   |   0.08   |   0.10   |   0.75   |   0.75   |     2  |
At rank 1: Jogador   4 : Jada Knapp           | Scalipus        | 12/08/2002 | F    |  0.25   |   0.33   |   0.10   |   0.80   |   0.75   |     2  |
At rank 2: Jogador   5 : Sawyer Short         | Scalipus        | 07/12/2004 | M    |  0.17   |   0.25   |   0.15   |   0.90   |   0.80   |     2  |
...

Cluster 5 ----LIST elements:
At rank 0: Jogador   2 : Sasha Nolan          | Scalipus        | 28/02/2002 | F    |  0.92   |   0.83   |   0.20   |   0.15   |   0.35   |     2  |
At rank 1: Jogador   7 : Lester Jarvis        | Scalipus        | 01/12/2000 | M    |  0.83   |   0.67   |   0.40   |   0.20   |   0.10   |     1  |
At rank 2: Jogador   9 : Russell Alvarez      | Scalipus        | 09/09/2000 | M    |  0.94   |   0.83   |   0.27   |   0.17   |   0.23   |     3  |
...
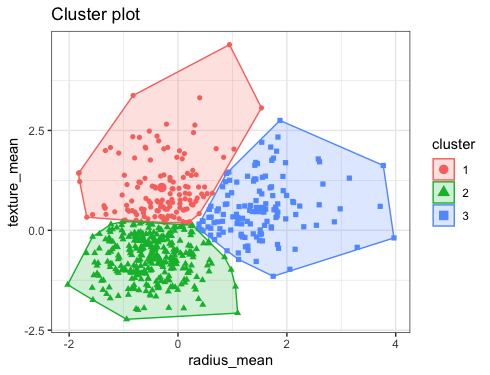
Insights
The clusters can be divided by the characteristics of the players. Each cluster is well-balanced in terms of their range of a given set of characteristics.
For example, Cluster 1’s players have similar performance in all values, having low 2Point and 3Point scores, but high Fouls, Assists and Blocks.
Since the data isn’t three-dimensional, we cannot represent it easily in a simple graph. That would only be achievable if we select three of the studied dimensions.
If this interests, and you’d like to try it out yourself, feel free to check the code.